Analysis of cash flows of investment projects. How to calculate cash flow
The purpose of the article is to develop a methodology for calculating cash flows in the forecast and extended periods and the value of the company, as well as determining their changes under the influence of main factors.
Alexander Samylin
Valuation of company cash flows
"Economic Strategies", No. 08-2008, pp. 120-125
Introduction
From the beginning of the transition to market economy The company's financial management has undergone changes. At the first stage, the main goal of management was to maximize profits, and at the second - to expand and conquer new markets. As competition grew and unoccupied business niches disappeared, the emphasis in financial management began to shift to increasing the profitability of activities. Currently, the target function of management is increasingly becoming the growth of the company's economic profit, increasing the value of the business and cash flows directed to shareholders and investors.
Competitors, buyers, suppliers and investors, when selling a company, in case of attracting financing and in the process of business planning of financial and economic activities, are increasingly asking the question: how much is your business and your company worth? This question is not idle, and the answer to it determines the level of risk for counterparties when establishing cooperation with this company and when accepting management decisions. A company whose value is higher and which generates large cash flows, other things being equal, is characterized by lower risks in terms of investment and return on invested capital.
An assessment of the value of a company is necessary during the purchase and sale, during the reorganization of the company, in accordance with Article 57 of the Civil Code of the Russian Federation, during insurance, for registration of collateral when obtaining a loan, in the process of preparing a prospectus for the issue of securities and organizing the circulation of securities on the stock exchange, when searching for an investor and in others cases. All this determines the relevance of the problem of assessing the value of a company and the cash flows it generates.
The value of a company should be understood primarily as a complex indicator in monetary terms that determines the state of all areas of activity, including ordinary activities, financial and investment activities minus liabilities. To the mentioned areas of activity characterized by financial indicators, one should also add activities aimed at increasing the level of professionalism of employees, maintaining and improving the company’s image. Such activities are characterized by non-financial indicators, which for the most part are not yet formalized mathematically, but also contribute to increasing the value of the company. Therefore, the value of a company can be defined as the totality of its assets, invested capital, its return in the forecast and extended periods, minus liabilities.
When calculating the value of a company, they use financial statements, which reflect information about assets and liabilities.
At the same time, the cash flows generated by the company resulting from the increase working capital And capital investments, for example, fixed assets and intangible assets, are not reflected in the financial statements. Therefore, it is necessary to develop a methodology for calculating cash flows in the forecast and extended periods and the value of the company, and determine their changes under the influence of main factors. Solving these problems was the purpose of the article.
Types and methods of assessing the value of a company
According to the Decree of the Government of the Russian Federation No. 519 of 07/06/2001 “On approval of valuation standards”, a distinction is made between: the market value of the valuation object and the types of value of the object that are used in specific economic situations, for example: the value of the valuation object with a limited market, the cost of replacement and reproduction , disposal and liquidation value, investment value and value for tax purposes.
Calculation of the company's value is carried out on the basis of one of three approaches: cost, comparative or income. The cost approach is based on determining value by establishing the costs that are necessary to restore or replace the valued object, taking into account its wear and tear. This approach is used to value newly created companies and is based on the net asset method and the liquidation value method. With the comparative approach, the value of an object is determined based on a comparison of the value of objects that have similar and homogeneous evaluation and comparison criteria. The comparative approach uses three valuation methods: the capital market method, the industry ratio method and the transaction method. In the first two cases, the value of the operating company is assessed, and in the last - the value of the company that changes its type of activity. The income approach is based on determining the cash flows generated by the company and calculating net cash flow as the difference between discounted cash inflows and outflows. This approach is used when implementing investment projects and investments in intellectual property. The period of time during which it is planned to receive income is divided into two periods: forecast, characterizing cash flows during the implementation of the project, and extended - upon completion of the project. In the first step, future cash flows are forecast, in the second step, future cash flows are converted to present value, and in the third step they are reflected in the forecast cash flow statement. In an unstable economy, forecasting cash flows is difficult, which narrows the scope of application of this approach. The income approach uses two methods: the profit capitalization method and the discounted cash flow method. The capitalization method is used for companies that have established cash flows - both their receipts from investors and shareholders, and the return on invested capital. The discounted cash flow method is used for companies that make profits through competitive advantages.
Methods for estimating a company's value and the cash flows generated have changed over time. Initially, calculations were carried out using moment and interval multipliers, profitability and profit indicators. Currently, a number of specialized complex indicators are used.
The following methods of valuation are distinguished:
- using discounted cash flow indicators, for example FCF (Free Cash Flow), ECF (Equity Cash Flow). The CCF indicator is used when the amount of cash flowing to shareholders and investors is established, and the ECF indicator is used when the amount of cash flows to shareholders after the repayment of debt obligations is established;
- using indicators, for example NPV (Net Present Value), APV (Adjusted Present Value), when the company can be presented as a set of parts, each of which can be assessed as an investment project. If there are one-time or distributed investments, the NPV indicator is used. Its difference from the APV indicator is that in the case of the APV indicator, “tax protection” is used;
- based on the principle of residual income using indicators, for example EVA (Economic Value Added), MVA (Market Value Added). The use of the EVA indicator makes it possible to determine whether shareholders receive the same return on invested share capital as in the case of its investment in alternative projects. Market value added (MVA) measures enterprise value based on market capitalization and market value of debt, but does not take into account intermediate shareholder returns and the opportunity cost of invested capital;
- based on combining income and expenses - EBO (Edwards-Bell-Ohlson valuation model), when cost and income approaches are combined taking into account the value of net assets.
The value of the company is determined as the sum of the cost share capital and excess profits, calculated as discounted cash flow.
Calculation and change in the value of a company under the influence of main factors
A methodology has been developed for calculating cash flows when a number of key factors change. In table 1 shows an example of calculating cash flows with the following values of factors in the forecast period: revenue growth rate - 25%, cost growth rate - 15%, growth rate of commercial and administrative expenses - 7%, weighted average cost of capital - 20%, growth rate of invested capital - 8%, the growth rate of depreciation charges is 6%. The growth rate of these factors in the extended period is 5%.
Based on the proposed methodology, the change in the value of the company's cash flows under the influence of main factors was analyzed. The range of factor values is established based on the business conditions of companies engaged in different types activities.
The change in cash flows and company value when the profit growth rate changes is shown in Fig. 1. The calculation was carried out under the condition that the values of the factors remain unchanged: the growth rate of revenue for the extended period qn is equal to 5%, the value of the investment rate NI in the forecast and extended period is equal to 14.4%, the amount of capital invested at the beginning of the forecast period IC = 53.2 thousand rubles ., the amount of depreciation charges of the joint-stock company attributable to fixed production assets is 15 thousand rubles.

The values of the weighted average cost of capital WACC and the return on invested capital ROIC varied.
The presented graph shows that the amount of cash flows due to the increase in working capital and investment investments differs by year of the forecast and extended periods and decreases as the WACC value increases from 6 to 30%. This is due to an increase in the cost of attracted capital, as a result of which the company has less available funds at its disposal and cash flows decrease. A noticeable difference in cash flows begins at WACC = 10%. With an increase in the growth rate of profit NOPLAT q from 5 to 35%, which is determined by the multidirectional influence of such factors as sales proceeds, cost of sales, commercial and administrative expenses, the amount of cash flows increases. With an increase in the WACC value by 6 times, cash flows increase relatively slightly, namely from 911 thousand to 1567 thousand rubles, or 1.7 times with WACC = 30%. A significant change in cash flow occurs at a value of WACC = 6%, when this value changes from 22,780 thousand to 47,896 thousand rubles, or 2.1 times. With an expected annual growth rate in the range of 15-20% and the price of attracted capital in the range of 15-20%, the company can, when planning financially, focus on cash flows in the range from 2000 to 3500 thousand rubles.
The dependence of changes in the value of cash flows on changes in the investment rate NI is presented in Fig. 2. The calculation was performed at a constant profit growth rate in the forecast and extended periods. Accordingly, q = 15%, qn = 5%, JSC amount = 15 thousand rubles. The amount of cash flows decreases as the fee for borrowed capital increases. With an increase in the value of NI, the amount of cash flow decreases from 33,033 thousand to 22,624 thousand rubles. with WACC = 6% and from 1218 thousand to 834 thousand rubles. with WACC = 30%. There is a decrease in cash flow by 31.5%.

The growth of NI is determined by the increase in working capital and capital investments. As a result, free cash flow decreases, which determines the decrease in final cash flow. This is accompanied by a drop in ROIC by 3.5 times: from 1.51 to 0.43. A significant change in cash flows is observed in the WACC range from 6 to 15%. The conditions under which farming is possible is the NI range from 30 to 35%.
In this case, when doing financial planning, the company can use cash flows in the calculations in the amount of 2,000 thousand to 3,000 thousand rubles. in the selected WACC range from 15 to 20%.
In Fig. Figure 3 shows the dependence of changes in cash flows on the amount of depreciation charges. The calculation was made based on the assumption that the rate of profit growth in the forecast and extended periods is the same and amounts to 15%: q = qn = 15%, the amount of invested capital is equal to 53.2 thousand rubles. The graph shows that with a change in the weighted average cost of capital from 6% to 30%, or 5 times, cash flow decreases by 27.1 times, which is explained by the diversion of significant funds to pay for the capital attracted by the company. With an increase in the amount of depreciation charges from 10 thousand to 50 thousand rubles. cash flow increases: with WACC = 6% - from 29,136 thousand to 34,367 thousand rubles, and with WACC = 30% - from 1074 thousand to 1267 thousand rubles. When the amount of joint stock company increases by 5 times, the cash flow increases by 1.18 times. The increase in cash flow is determined by the growth of gross cash flow and free cash flow with a decrease in the investment rate from 16.2 to 12.5%. In accordance with the IFRS IAS 16 “Fixed Assets” standard, the method of calculating depreciation can change during the life of the asset, which means that it is possible to regulate cash flows using the AO factor.

In Fig. Figure 4 shows the dependence of changes in cash flows on the value of return on invested capital ROIC. Calculations were carried out on the basis of the assumption of a constant value of AO = 15 thousand rubles. and investment rates NI = 14.4% in the forecast and extended periods. The amount of cash flow falls with an increase in the WACC value from 6 to 30%, which is due to an increase in the diversion of funds to pay for attracted capital. As ROIC increases, cash flow increases, which is due to an increase in the capital attracted by the company. With WACC = 6%, the amount of cash flow increases from 20,156 thousand to 22,806 thousand rubles, and with WACC = 15% - from 2054 thousand to 2280 thousand rubles. With WACC values from 20 to 30%, cash flow changes slightly and is in the range from 840 thousand to 1520 thousand rubles. For the company, it is preferable to increase the ROIC value. If the ROIC value is > 30%, the financial planning process can take into account cash flows in the range from 2000 thousand to 3000 thousand rubles.
The dependence of the change in cash flow on the value of IC is shown in Fig. 5. Calculations were made based on the assumption that the profit growth rate in the forecast period is 15%, and in the extended period – 5%, the amount of joint stock company = 15 thousand rubles, at the beginning of the analyzed period the amount of invested capital IC = 50 thousand rubles. The decrease in cash flow with an increase in the WACC value from 6 to 30% is explained by the same reasons as in the other graphs above. It is most noticeable at WACCs of 6 to 15% and is virtually constant at WACCs of 15 to 30%. Decrease in cash flow when the IC value changes from 50 thousand to 250 thousand rubles. explained by a decrease in free cash flow with an increase in the investment rate from 13.2 to 88.3%. The results obtained indicate that the greatest influence on changes in the value of the company is exerted by the q factor with a rate of change of about 110% and the IC factor with a rate of change of about 86%.

Conclusion
You can increase the value of your company in the following ways:
- due to the structural restructuring of the company, when the main attention is paid, for example, to changing the management structure, to the formation of financial responsibility centers in the company, expanding their rights and increasing responsibility, to developing a system of labor motivation and employee interest in the final result. The costs of this method are significantly lower than when using other methods. The main problem is to explain to employees the need for changes and teach them new ways of working;
- by increasing the transparency and openness of the company for investors, suppliers, buyers and other interested users. This can be achieved, for example, by switching to International Financial Reporting Standards, disseminating information about the state of affairs and development prospects of the company through rating agencies.The disadvantages of this method are longer implementation times and higher costs than when using the first method, since the main emphasis is on attracting foreign capital, and therefore on creating an attractive image of the company abroad;
- through the development of industrial potential through, for example, the expansion of production, the introduction of new and reconstruction of existing facilities. A company that has invested in an investment project will reduce its profitability and profitability indicators in the current period, but with the receipt of cash flows at the beginning of the return from the investment project (in the forecast period) and after its completion (in the extended period), having increased potential, it will significantly increase its attractiveness and value. This is the most promising method and the most expensive, since it is associated with increased risks;
- due to the selection of optimal values of influencing factors based on the conducted research. Their results can be used in drawing up a cash flow report using the budgeting method and forecast financial reporting.
PES 8278/09.11.2008
Literature:
1. Gryaznova A.G., Fedotov M.A., Eskindarov M.A., Tazikhina T.V., Ivanov E.N., Shcherbakova O.N. Estimation of the value of an enterprise (business). M.: INTERREKLAMA, 2003, p. 544.
2. Copeland T., Koller T., Murrin J. Cost of companies: assessment and management / Transl. from English M.: ZAO "Olympus Business", 1999, p. 576.
3. Popov D. Evolution of indicators of the enterprise development strategy // Company Management. 2003. No. 1, p. 69-75.
4. Atkinson A., Epstein M. Measure for measure: Realizing the power of the balanced scorecard // CMA Management. September 2000, p. 22-28.
5. Kaplan R.S., Norton D.P. Linking the balanced scorecard to strategy // California Management Review. 1996. Vol. 4, Fall, p. 53-79.
The basic concept in the income approach is net cash receipts or net cash flows, defined as the difference between the inflow and outflow of funds over a certain period of time.
Using the discounted cash flow method, you can calculate either the so-called “cash flow for equity” or the “cash flow for total invested capital.”
When valuing Bitum LLC, a cash flow model for equity capital was applied. When using this model, the cost of equity capital of the company is calculated. Cash flow for equity is determined according to the following scheme:
net profit after taxes
Depreciation deductions
Increase in long-term debt
+ (-) decrease (increase) of own working capital
+ (-) decrease (increase) in investments in fixed assets
Reducing long-term debt
___________________________________
Cash flow
Cash flow is calculated on a nominal basis, i.e. at current prices.
The financial cycle of an enterprise is calculated using the formula:
F c = O d.z. + About z. - About k.z.
where F c is the financial cycle;
About d.z. - accounts receivable turnover;
O z. - inventory turnover;
About short circuit - accounts payable turnover.
Since in our case we assume that the enterprise’s offsets will be carried out in a timely manner, receivables and payables are mutually repaid. Consequently, the financial cycle will depend on the inventory turnover of the enterprise. Inventory turnover includes the turnover of raw materials and supplies, low-value and wear-and-tear goods, finished products, shipped goods, and other goods and materials. Inventory turnover also includes the turnover of raw materials and supplies, low-value and wear-and-tear goods, finished goods, shipped goods, and other goods and materials. Inventory turnover also includes VAT on purchased items. This is all reflected in lines 210 and 220 of Form 1 of the balance sheet of the operating enterprise. From here, the inventory turnover period is calculated using the formula:
where Z av – the average value of inventories for the initial and final periods (line 210 of Form 1 of the balance sheet);
VAT av – the average value of VAT on purchased assets for the initial and final period (page 220 of Form 1 of the balance sheet);
On Wed – the average value of revenue for the initial and final periods (line 010 of Form 2 of the balance sheet);
360 – number of days in the period.
Calculating using this formula, we obtain the values of inventory turnover periods for 2001, 2002 and 2003. They are 42, 64 and 104 days respectively.
The average inventory turnover period for these three years is:
P ob.z. = (42+64+104)/3 = 70 days
Based on this, we calculate the enterprise’s need for working capital (required working capital):
where K tr.ob. – required working capital,
360 – number of days in the period.
Thus, the increase in working capital will be calculated as a percentage (19.4%) of the difference in sales revenue between adjacent intervals.
The calculation of cash flow for the first forecast year takes into account loan repayment.
At the next stage of using the discounted future cash flow method, the total amount of income that can be received in the post-forecast period is calculated. We calculated the amount of income in the post-forecast period using the Gordon model, which looks like this:

V is the total amount of income in the post-forecast period;
D is the cash flow that may be at the beginning of the third year;
r – discount rate for equity capital (0.42);
R – expected long-term stable growth rate of cash flow, in our case equal to 5%.
Gordon's model is based on the forecast of stable income in the residual period.
When carrying out the discounting procedure, it is necessary to take into account how cash flows arrive over time (at the beginning of each period, at the end of each period, evenly throughout the year).
In our calculations, it is assumed that the company receives income and makes payments evenly throughout the year. Thus, discounting of cash flows is carried out for mid-period according to the following formula:

PV – present value of future income;
r – discount rate;
n – number of periods.
Let's look at the types of cash flows of an enterprise: economic sense indicators – net cash flow (NCF) and free cash flow, their construction formula and practical examples of calculation.
Net cash flow. Economic sense
Net cash flow (EnglishNetCashflow,NetValueNCF, present value) – is a key indicator of investment analysis and shows the difference between positive and negative cash flow for a selected period of time. This indicator determines financial condition the enterprise and the ability of the enterprise to increase its value and investment attractiveness. Net cash flow is the sum of cash flow from operating, financing and investment activities enterprises.
Consumers of the net cash flow indicator
Net cash flow is used by investors, owners and creditors to evaluate the effectiveness of an investment in an investment project/enterprise. The value of the net cash flow indicator is used in assessing the value of an enterprise or investment project. Since investment projects can have a long implementation period, all future cash flows lead to a cost of currently time (discounted), the result is the NPV indicator ( NetPresentValue). If the project is short-term, then discounting can be neglected when calculating the cost of the project based on cash flows.
Estimation of NCF indicator values
The higher the net cash flow value, the more investment attractive the project is in the eyes of the investor and lender.
Formula for calculating net cash flow
Let's consider two formulas for calculating net cash flow. So net cash flow is calculated as the sum of all cash flows and outflows of the enterprise. And the general formula can be represented as:
NCF – net cash flow;
C.I. (Cash Inflow) – incoming cash flow, which has a positive sign;
CO (Cash Outflow) – outgoing cash flow with a negative sign;
n – number of periods for assessing cash flows.
Let us describe in more detail the net cash flow by type of activity of the enterprise; as a result, the formula will take the following form:
![]() Where:
Where:
NCF – net cash flow;
CFO – cash flow from operating activities;
CFF – cash flow from financial activities;
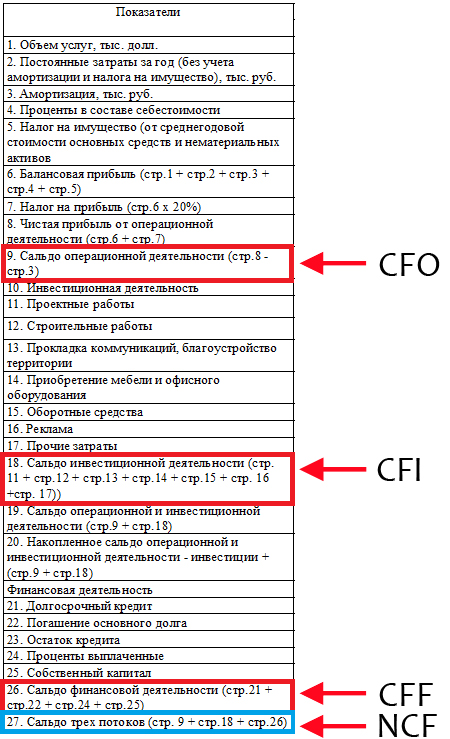
Example calculation of net cash flow
Let's look at a practical example of calculating net cash flow. The figure below shows the method of generating cash flows from operating, financing and investing activities.
Types of cash flows of an enterprise
All cash flows of an enterprise that form net cash flow can be divided into several groups. So, depending on the purpose of use, the appraiser distinguishes the following types of cash flows of an enterprise:
- FCFF is the free cash flow of the company (assets). Used in valuation models for investors and lenders;
- FCFE – free cash flow from capital. Used in models for assessing value by shareholders and owners of the enterprise.
Free cash flow of the company and capital FCFF, FCFE
A. Damodaran distinguishes two types of free cash flows of an enterprise:
- Free cash flow of the company (FreeCashFlowtoFirm,FCFFFCF) is the cash flow of an enterprise from its operating activities, excluding investments in fixed capital. A firm's free cash flow is often simply called free cash flow, i.e. FCF = FCFF. This type of cash flow shows how much cash the company has left after investing in capital assets. This flow is created by the assets of the enterprise and therefore in practice it is called free cash flow from assets. FCFF is used by the company's investors.
- Free cash flow to equity (FreeCashFlowtoEquity,FCFE) – cash flow of an enterprise only from the enterprise’s own capital. This cash flow is usually used by the company's shareholders.
A firm's free cash flow (FCFF) is used to assess enterprise value, while free cash flow to equity (FCFE) is used to assess shareholder value. The main difference is that FCFF evaluates all cash flows from both equity and debt, while FCFE evaluates cash flows from equity only.
The formula for calculating the free cash flow of a company (FCFF)
EBIT ( Earnings Before Interest and Taxes) – earnings before taxes and interest;
СNWC ( Change in Net Working Capital) – change in working capital, money spent on the acquisition of new assets;
Capital Expenditure) .
J. English (2001) proposes a variation of the formula for a firm's free cash flow, which is as follows:
CFO ( CashFlow from Operations)– cash flow from the operating activities of the enterprise;
Interest expensive – interest expenses;
Tax – interest rate income tax;
CFI – cash flow from investment activities.
Formula for calculating free cash flow from capital (FCFE)
The formula for estimating free cash flow of capital is as follows:
NI ( Net Income) – net profit of the enterprise;
DA – depreciation of tangible and intangible assets;
∆WCR – net capital costs, also called Capex ( Capital Expenditure);
Investment – the amount of investments made;
Net borrowing is the difference between repaid and received loans.
The use of cash flows in various methods for assessing an investment project
Cash flows are used in investment analysis to evaluate various project performance indicators. Let's consider the main three groups of methods that are based on any type of cash flow (CF):
- Statistical methods for evaluating investment projects
- Payback period of the investment project (PP,PaybackPeriod)
- Profitability of an investment project (ARR, Accounting Rate of Return)
- Current value ( N.V.NetValue)
- Dynamic methods for evaluating investment projects
- Net present value (NPVNetPresentValue)
- Internal rate of return ( IRR, Internal Rate of Return)
- Profitability index (PI, Profitability index)
- Annual annuity equivalent (NUS, Net Uniform Series)
- Net rate of return ( NRR, Net Rate of Return)
- Net future value ( NFV,NetFutureValue)
- Discounted payback period (DPPDiscountedPayback Period)
- Methods that take into account discounting and reinvestment
- Modified net rate of return ( MNPV, Modified Net Rate of Return)
- Modified rate of return ( MIRR, Modified Internal Rate of Return)
- Modified net present value ( MNPV,ModifiedPresentValue)
All these models for assessing project performance are based on cash flows, on the basis of which conclusions are drawn about the degree of project effectiveness. Typically, investors use the firm's free cash flows (assets) to evaluate these ratios. The inclusion of free cash flows from equity in the formulas for calculating allows us to focus on assessing the attractiveness of the project/enterprise for shareholders.
Summary
In this article, we examined the economic meaning of net cash flow (NCF), showed that this indicator allows us to judge the degree investment attractiveness project. Considered different approaches in the calculation of free cash flows, which allows us to focus on valuation, both for investors and shareholders of the enterprise. Increase the accuracy of the assessment of investment projects, Ivan Zhdanov was with you.
Financial analysts and economists are increasingly being let down. Practice shows that companies try to embellish existing indicators, easily maneuvering numbers and financial reporting indicators. Another thing - cash flows: they are more difficult to distort, they are real, based on existing and confirmed facts of cash flow.
Money odds characterize the company’s ability to finance operating activities, attract new investments, help with financial modeling of the company’s behavior in future periods (especially its ability to repay received loans) and in planning repayment schedules to avoid cash gaps.
In 1993, D. Giacomino and D. Mielke proposed using cash ratios to assess the sufficiency of cash flows to finance the needs of the organization and assess the efficiency of generating cash flows by the company (Giacomino D.E., and Mielke D.E. 1993. Cash flows: Another approach to ratio analysis. Journal of Accountancy (March)).
Let's consider the main monetary ratios that characterize the company's ability to finance its operating activities.
Cash content of sales
To determine the ratio, it is necessary to take into account that gross current cash receipts (Cash Receipts) may be credited to past credit sales. The Gross Cash Flow from Operations to Sales ratio is calculated using the formula:
Dsp = (Dpp + Z) / V
Where, DSP is the cash content of sales; DPP - cash receipts from sales; Z - payments for work performed; B - revenue.
Note that revenue includes not only current sales, but also interim payments as work is completed under contracts (percentage of completion method), that is, this is similar to a return to the cash method of accounting.
Cash return on sales
The Cash Return on Sales ratio shows the net operating cash inflow per unit of sales (after taking into account all cash outflows associated with sales in the current period) and is defined as:
Drp = DPo / V
Where, OPO is operating cash flow.
It is useful to compare this metric to the traditional accounting operating margin.
Cash content of operating margin
The indicator is calculated as the ratio of cash return on sales to operating margin in percentage terms, or as the ratio of net operating cash flow to operating profit multiplied by 100%. The calculation formula looks like:
House = (DPo / Po) x 100%
Where, House is the cash content of the operating margin; Po - operating profit.
This ratio can be higher than 100%, since profit includes non-cash expenses, primarily depreciation.
Cash content of net profit
The developers of US GAAP and IFRS-IAS standards recommend comparing cash flow from operating activities with net profit. Cash ratio net profit shows the extent to which net profit is expressed in the form real money, and in which - in the form of notes on paper:
Dchp = Dpch / ChP
Where, DPP is the cash content of net profit; DPc - net cash flow from operating activities; PE - Net profit.
An alternative to assessing earnings quality is the adjusted net income content ratio, which compares operating cash flow after depreciation and amortization to net income. This makes it possible to better assess what percentage of profit consists of cash receipts:
Dchp = (Dpch - A) / ChP
Where, A is the depreciation of tangible and intangible assets.
A similar procedure can be done with the operating margin cash ratio.
Operating cash flow to EBITDA
Shows the real cash content of operating profit before interest and depreciation, the coefficient is calculated using the formula:
Dod = DPh / EBITDA
Where, Dod is operating cash flow.
CFO to EBITDA is a rarely used ratio, but it can help assess the quality of earnings with depreciation and amortization recovered.
Cash to revenue
The Cash to Sales Ratio characterizes the sufficiency or excess of the company’s cash resources:
Ds/v = (M + CB) / V
Where, Дс/в - ratio of cash to revenue; M - money and cash equivalents; Central Banks are easily marketable securities.
As a rule, this ratio is compared with the industry average or with the practice of the best companies.
It should be noted that a simple comparison of the ratio of a company's cash to revenue is quite arbitrary. Since the need for funds depends not only on the size of the company’s revenue, but also on the amount of financial leverage, the company’s investment plans and many other parameters. A company can deliberately create stabilization funds, debt repayment funds, insurance and liquid reserves for a rainy day. In this case, it is more appropriate to adjust the formula:
Ds/v = (M + CB) / (Np + Kz)
Where, Нп - urgent payments; Кз - planned capital expenditures.
If the ratio is greater than 1, then the company has excess cash.
Cash flow to total debt
The Cash Flow from Operations to Total Debt Ratio indicator most fully predicts the financial insolvency of companies, according to William Beaver. The formula for calculating the indicator is:
Dp/d = DPod / R
Where, Dp/d - cash flow to total debt; Cash flow from operating activities; P - total debt.
The inverse of this coefficient can be called: total debt to annual cash flow:
The ratio is used to assess a company's credit position and shows the length of time it would take to pay off debt if all operating cash flow (which was often considered comparable to EBITDA) was used to pay off debt. The lower the value of this coefficient, the better.
Cash coverage ratio
The ratio shows the company’s ability to pay off its debts while complying with the stated parameters dividend policy. The coefficient is calculated using the formula:
Ds/d = (DPod - Dv) / R
Where, Ds/d is the cash debt coverage ratio; Dv - dividends.
Cash / Debt Coverage ratio is similar to the above cash flow to total debt ratio. The difference is that the numerator subtracts dividends (which are often mandatory payments) from operating cash flow.
Debt repayment period(Years Debt) is the inverse of the cash debt coverage ratio:
It informs about the number of years during which the company will be able to pay off its debt, without forgetting to pay dividends to shareholders. This is a simpler way of expressing the information provided by the cash coverage ratio.
Cash coverage ratio for the current portion of long-term debt(Cash Maturity Coverage Ratio) - the ratio of cash flow from operating activities minus dividends to the current portion of long-term debt:
Dcm = (DP - Dv) / RT
Where, DSM is the cash coverage ratio of the current portion of long-term debt; RT is the current portion of long-term debt.
The indicator reflects the ability to pay long-term debts as they fall due. When attracting long-term borrowed funds, it is a good idea to check the ability to repay them through operating activities. So this ratio can be used even at the stage of planning and developing financial policy and largely shows the debt burden on operating cash flow.
Dividends are deductible because the company must retain equity capital and satisfy at least the minimum requirements of shareholders.
Total free cash flow ratio
The Total Free Cash Ratio shows the company's ability to repay current debt obligations without harming operating activities and shareholders and is calculated using the formula:
Dsds = (Pr + Pr + A + Ar - Two - KZ) / (Pr + Ar + RT + From)
Where, Dsds is the coefficient of total free cash flows; Pr - accrued and capitalized interest expenses; Ar - rental and operating leasing expenses; Two - declared dividends; KZ - capital costs; From - the current part of capital leasing obligations.
The estimated amount required to maintain the current level of operating activity (maintenance CAPEX) can be used as capital investment. It is often determined as a percentage of total assets or the value of fixed assets.
Debt service coverage ratio
The classic Debt Service Coverage Ratio is calculated as the ratio of earnings before interest, taxes, and depreciation to the annual interest and principal payments.
DSCR = EBITDA / Annual interest and principal payments
The debt service coverage ratio is a leading indicator. The cash flow statement version of this ratio is to include operating cash flow in the numerator.
Cash Interest Coverage Ratio
In good years, the company has the ability to refinance its long-term debt, so it can survive even if the cash coverage ratio of the current portion of its long-term debt is poor. However, the company is not able to refuse to pay interest payments. Cash Interest Coverage Ratio shows a company's ability to pay interest.
CICR = (DC + Pu + N) / Pu
Where, Pu - interest paid; N - taxes paid.
This ratio is more accurate than the Earning Interest Coverage Ratio because a low Earnings Interest Coverage Ratio does not mean that the company does not have money to pay interest, just as a high value does not mean that the company has money to pay interest.
Cash flow adequacy ratio
The Cash Flow Adequacy Ratio is the ratio of annual net free cash flow to the average annual debt payments for the next 5 years (however, it is more applicable in stable conditions). The denominator allows you to smooth out unevenness in payments of principal amounts of debt. The numerator also takes into account cyclical changes in capital financing.
CFAR = NFCF / DVsr
Where, NFCF is annual net free cash flow; DVSR - average annual debt payments over the next 5 years
The client’s cash flow indicators are less susceptible to distortion compared to the balance indicators of the financial statements, since they directly correspond with the cash flow of his counterparties.
Money odds are based on the fact of the presence or absence of funds from the enterprise. Cash flows are ideal for assessing solvency. If a company does not have enough cash, it is unable to finance its ongoing operations, pay off debts, pay salaries and taxes. The emptiness in a corporate wallet can be noticed long before the onset of official insolvency. The application of some of these ratios in banking practice is already a fait accompli. Cash flows make it possible to establish the quality (cash content) of the company's paper revenue and profits, which are assessed primarily when issuing loans.
The main goal of any enterprise is to make a profit. Subsequently, the profit indicator is reflected in a special tax report on financial results - it is this indicator that indicates how efficient the operation of the enterprise is. However, in reality, profit only partially reflects a company's performance and may not provide any insight into how much money the business actually makes. Full information This issue can only be learned from the cash flow statement.
Net profit cannot reflect the funds received in real terms - the amounts on paper and the company's bank account are different things. For the most part, the data in the report is not always factual and is often purely nominal. For example, revaluation of exchange rate differences or depreciation charges do not bring in real cash, and funds for goods sold appear as profit, even if the money has not yet actually been received from the buyer of the goods.
It is also important that the company spends part of its profits on financing current activities, namely on the construction of new factory buildings, workshops, retail outlets— in some cases, such expenses significantly exceed the company’s net profit. As a result of all this big picture may be quite favorable and in terms of net profit the enterprise may be quite successful - but in reality the company will suffer serious losses and not receive the profit indicated on paper.
Free cash flow helps to make a correct assessment of a company's profitability and assess the real level of earnings (as well as better assess the capabilities of a future investor). Cash flow can be defined as the funds available to a company after all due expenses have been paid, or as the funds that can be withdrawn from the business without harming the business. You can obtain data for calculating cash flows from the company’s report under RAS or IFRS.
Types of Cash Flows
There are three types of cash flows, and each option has its own characteristics and calculation procedure. Free cash flow is:
from operating activities - shows the amount of cash that the company receives from its main activity. This indicator includes: depreciation (with a minus sign, although no funds are actually spent), changes in accounts receivable and credit, as well as inventory - and in addition other liabilities and assets, if present. The result is usually displayed in the “Net cash from core/operating activities.” Symbols: Cash Flow from operating activities, CFO or Operating Cash Flow, OCF. In addition, the same value is simply referred to as cash flow Cash Flow;
from investment activities - illustrates the cash flow aimed at developing and maintaining current activities. For example, this includes the modernization / purchase of equipment, workshops or buildings - therefore, for example, banks usually do not have this item. In English, this column is usually called Capital Expenditures (capital expenses, CAPEX), and investments can include not only investments “in oneself”, but also be aimed at purchasing assets of other companies, such as shares or bonds. Denoted as Cash Flows from investing activities, CFI;
from financial activities - allows you to analyze the turnover of financial receipts for all operations, such as receipt or repayment of debt, payment of dividends, issue or repurchase of shares. Those. This column reflects the company's business conduct. A negative value for debts (Net Borrowings) means their repayment by the company, negative meaning for shares (Sale/Purchase of Stock) means purchasing them. Both of these characterize the company from the good side. In foreign reporting: Cash Flows from financing activities, CFF
Separately, you can dwell on promotions. How is their value determined? Through three components: depending on their number, the company’s real profit and market sentiment towards it. An additional issue of shares leads to a fall in the price of each of them, since there are more shares, and the company's results most likely did not change or changed slightly during the issue. And vice versa - if a company buys back its shares, then their value will be distributed among a new (fewer) number of securities and the price of each of them will rise. Conventionally, if there were 100,000 shares at a price of $50 per share and the company bought back 10,000, then the remaining 90,000 shares should cost approximately $55.5. But the market is the market - revaluation may not occur immediately or by other amounts (for example, an article in a major publication about a company’s similar policy can cause its shares to rise by tens of percent).
The situation with debts is ambiguous. On the one hand, it’s good when a company reduces its debt. On the other hand, wisely spent credit funds can lead the company to new level— the main thing is not to have too much debt. For example, at famous company Magnit, which has been growing actively for several years in a row, free cash flow became positive only in 2014. The reason is development through loans. Perhaps, during your research, it is worth choosing for yourself some limit of maximum debt, when the risks of bankruptcy begin to outweigh the risk of successful development.
When summing up all three indicators, it is formed Net cash flow - Net Cash Flow . Those. this is the difference between the inflow (receipt) of money into the company and its outflow (expense) in a certain period. If we are talking about negative free cash flow, then it is indicated in parentheses and indicates that the company is losing money, not earning it. At the same time, to clarify the dynamics, it is better to compare the company’s annual rather than quarterly performance in order to avoid the seasonal factor.
How are cash flows used to value companies?
You don't need to consider Net Cash Flow to get an impression of a company. The amount of free cash flow also allows you to evaluate a business using two approaches:
based on the value of the company, taking into account equity and borrowed (loan) capital;
taking into account only equity capital.
In the first case, all cash flows reproduced by existing sources of borrowed or equity funds are discounted. In this case, the discount rate is taken as the cost of capital attracted (WACC).
The second option involves calculating the value not of the entire company, but only of its small part - equity capital. For this purpose, discounting of FCFE's equity is carried out after all the company's debts have been paid. Let's look at these approaches in more detail.
Free Cash Flow to Equity - FCFE
FCFE (free cash flow to equity) is a designation of the amount of money remaining from the profit received after paying taxes, all debts and expenses for the operating activities of the enterprise. The calculation of the indicator is carried out taking into account the net profit of the enterprise (Net Income), depreciation is added to this figure. Capital costs (arising from upgrades and/or purchase of new equipment) are then deducted. The final formula for calculating the indicator, determined after paying off loans and processing loans, is as follows:
FCFE = Net cash flow from operating activities – Capital expenditures – Loan repayments + New loan originations
The firm's free cash flow is FCFF.
FCFF (free cash flow to firm) refers to the funds that remain after paying taxes and deducting capital expenses, but before making payments on interest and total debt. To calculate the indicator, you must use the formula:
FCFF = Net Cash Flow from Operating Activities – Capital Expenditures
Therefore, FCFF, unlike FCFE, is calculated without taking into account all loans and advances issued. This is what is usually meant by free cash flow (FCF). As we have already noted, cash flows may well be negative.
Example of cash flow calculation
In order to independently calculate cash flows for a company, you need to use its financial statements. For example, the Gazprom company has it here: http://www.gazprom.ru/investors. Follow the link and select the “all reporting” sub-item at the bottom of the page, where you can see reports since 1998. We find the desired year (let it be 2016) and go to the “IFRS Consolidated Financial Statements” section. Below is an excerpt from the report:

1. Let's calculate free cash flow to capital.
FCFE = 1,571,323 - 1,369,052 - 653,092 - 110,291 + 548,623 + 124,783 = 112,294 million rubles remained at the company's disposal after paying taxes, all debts and capital expenses (costs).
2. Let's determine the free cash flow of the company.
FCFF = 1,571,323 - 1,369,052 = 202,271 million rubles - this indicator shows the amount minus taxes and capital expenses, but before payments on interest and total debt.
P.S. In the case of American companies, all data can usually be found on the website https://finance.yahoo.com. For example, here is the data from Yahoo itself in the “Financials” tab:

Conclusion
In general, cash flow can be understood as the company’s free funds and can be calculated both with and without debt capital. A company's positive cash flow indicates a profitable business, especially if it grows year over year. However, any growth cannot be endless and is subject to natural limitations. In turn, even stable companies (Lenta, Magnit) can have negative cash flow - it is usually based on large loans and capital costs, which, if used correctly, can, however, provide significant future profits.
Dividing the company's market capitalization by the company's free cash flow, we get P/FCF ratio . Market Cap is easy to find on Yahoo or Morningstar. A reading of less than 20 usually indicates a good business, although any figure should be compared to competitors and, if possible, to the industry as a whole.